Bajaj Finance
Bajaj Finance: Can It Keep Up With Its Stellar Historical Returns?
Posted on: May 11, 2025
Author: Aman Singhal
📈 A Phenomenal Run
Bajaj Finance has been one of the biggest success stories in the Indian stock market. From being a niche non-banking financial company (NBFC), it has transformed into a powerhouse of retail lending, digital transformation, and aggressive expansion. Over the last decade, the stock has delivered CAGR returns of over 40%, turning early investors into crorepatis.
But the real question today is: Can Bajaj Finance continue to deliver similar returns going forward?
🏢 Company Overview
- Sector: Financial Services (NBFC)
- Market Cap: Over ₹4.5 lakh crore (as of May 2025)
- Loan Book: ₹3.3+ lakh crore
- Customer Base: 8 Crore+
- Segments: Consumer durable finance, personal loans, SME lending, rural lending, and more.
- Tech Focus: Bajaj Finserv app and web platform for 100% digital onboarding and loan disbursal.
📊 Historical Performance
| Metric | FY2015 | FY2020 | FY2024 | CAGR 10 years |
|---|---|---|---|---|
| Revenue | ₹6,000 Cr | ₹26,685 Cr | ₹49,000 Cr+ | 26% |
| Net Profit | ₹898 Cr | ₹5,264 Cr | ₹14,500 Cr+ | 35% |
| EPS | ₹16.4 | ₹87 | ₹240+ | 33% |
| Stock Price (Approx.) | ₹200 | ₹3,000 | ₹7,500 | 43% |
Business Brief
- Bajaj Finance make 88.6% of its revenue from interest income, 8.2% from fee income, and 3.2% from other income.
- AUM breakup
- Mortgage: 31.1%
- Consumer B2C: 21%
- SME lending: 12.1%
- Urban sales: 7%
- Commercial lending: 6.5%
- Loan against securities: 6.1%
- Rural B2C: 5.1%
- 2 and 3 wheelers: 4.2%
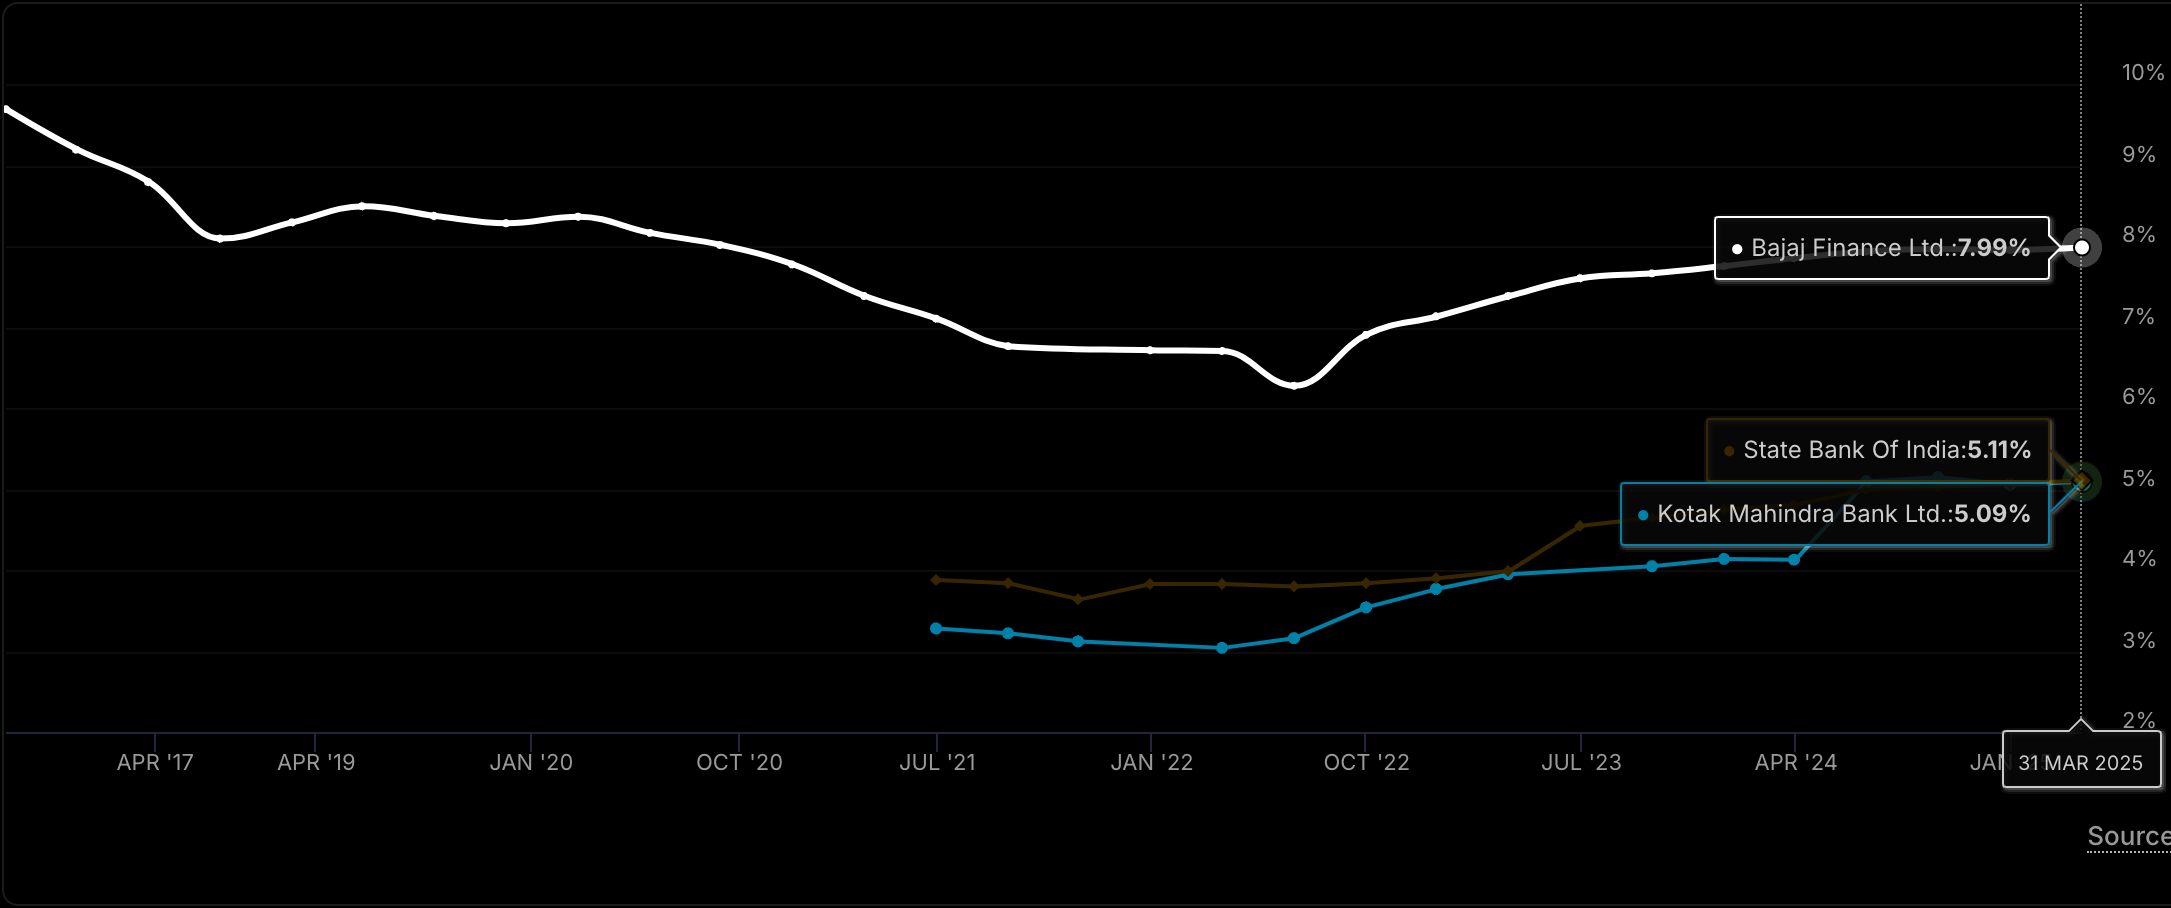
- NIM (Net Interest Margin) is around 10%.
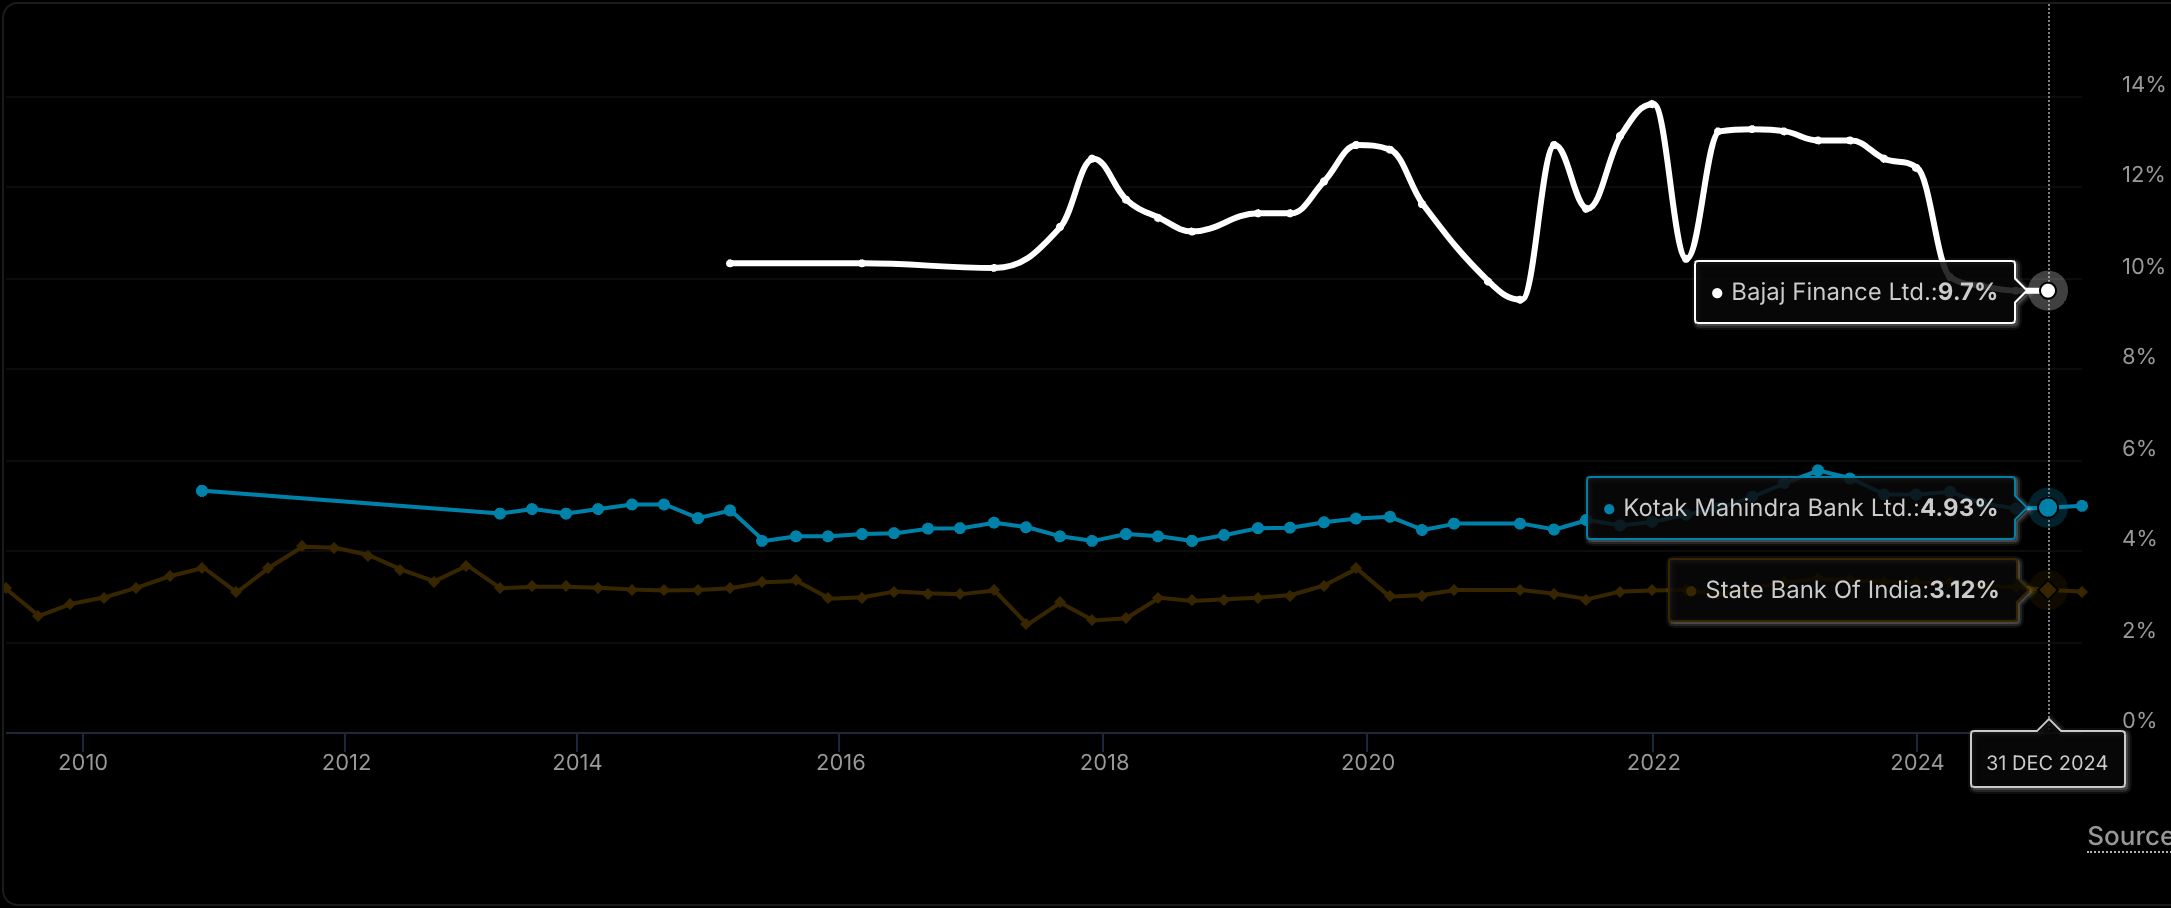
- Cost of borrowing is around 8%. This will go down with rate cuts in future
- 📊 Bajaj Finance AUM and YoY Growth
| Metric | FY2024 | FY2023 | FY2022 | FY2021 | FY2020 | FY2019 | FY2018 | FY2017 | FY2016 | FY2015 |
|---|---|---|---|---|---|---|---|---|---|---|
| AUM (₹ Crore) | 330,615 | 247,379 | 197,452 | 152,947 | 147,153 | 115,888 | 84,033 | 60,194 | 35,537 | 24,061 |
| YoY Growth | 33.6% | 25.3% | 29.0% | 3.9% | 26.9% | 38.0% | 39.6% | 69.4% | 47.7% | — |
- 📈 Bajaj Finance EPS and YoY Growth
| Metric | FY2024 | FY2023 | FY2022 | FY2021 | FY2020 | FY2019 | FY2018 | FY2017 | FY2016 | FY2015 |
|---|---|---|---|---|---|---|---|---|---|---|
| EPS (₹) | 234.0 | 190.0 | 117.0 | 73.4 | 88.0 | 105.4 | 74.3 | 46.2 | 29.1 | 16.4 |
| YoY Growth | 23.2% | 62.4% | 59.4% | -16.6% | -16.5% | 41.8% | 60.8% | 58.8% | 77.4% | — |
How much returns we can expect from Bajaj Finance in next 5 years?
today’s price: ₹8641 today’s PE: 32.32 today’s EPS: 267.73
| Metric | Worst Case | Base Case | Best Case |
|---|---|---|---|
| EPS Growth | 15% | 20% | 25% |
| PE | 20 | 25 | 30 |
| Price After 5 years | ₹10,776.16 | ₹16,661.00 | ₹24,538.20 |
| CAGR Returns | 4.53% | 13.92% | 21.86% |
we can keep our expectations in range of 14-15% CAGR returns in next 5 years.
🔍 Growth Drivers Going Forward
✅ Expanding Loan Book
Bajaj Finance plans to aggressively scale its loan book while maintaining asset quality. Penetration in Tier 3 and rural areas is a key lever.
✅ Tech + Scale = Advantage
With one of the most efficient digital infrastructures among NBFCs, it can grow fast without proportionate cost increases.
✅ Cross-Sell Opportunity
Over 80 million customers gives them immense scope to cross-sell credit cards, insurance, and investments.
✅ New Business Lines
Entry into payments, commerce, and wealth tech can provide new growth levers.
⚠️ Risks and Challenges
- RBI tightening on NBFCs could increase compliance cost.
- High valuation leaves little margin for error.
- Competition from fintechs and banks is intensifying.
- Credit risk in an economic slowdown.
🔮 Can It Sustain 30-40% CAGR?
It’s unlikely that Bajaj Finance can replicate the 40%+ CAGR it delivered over the last decade. Law of large numbers kicks in as the base grows. However:
- A 15–20% CAGR in earnings and stock price over the next 5–7 years is still highly possible.
- This is still above-average, especially for a large-cap financial stock.
🧠 Final Thoughts
Bajaj Finance is no longer a hidden gem — it’s a blue-chip, high-quality compounder. While past returns were exceptional, future returns will depend on earnings growth, asset quality, and ability to manage scale efficiently.
Disclaimer: This blog is for educational purposes only and does not constitute investment advice. Please consult your financial advisor before investing.